Physical Computing

Project 1 Documentation

Hannah Sancho


Module 1


Activity Research

Activity 1
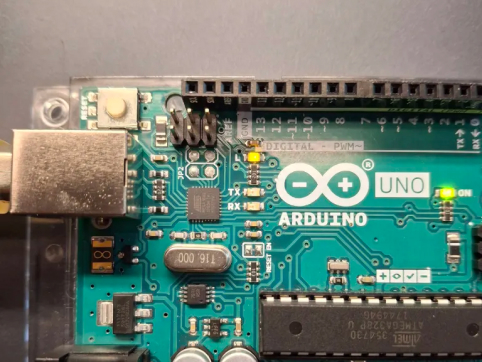
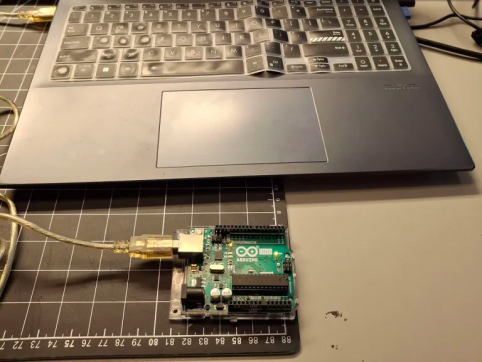
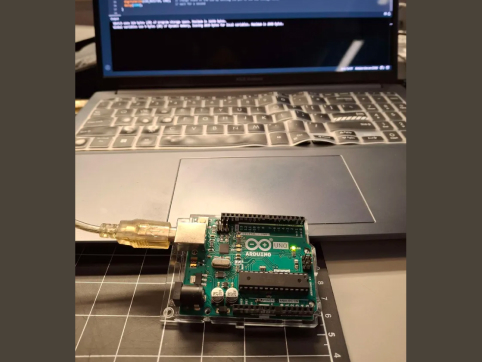
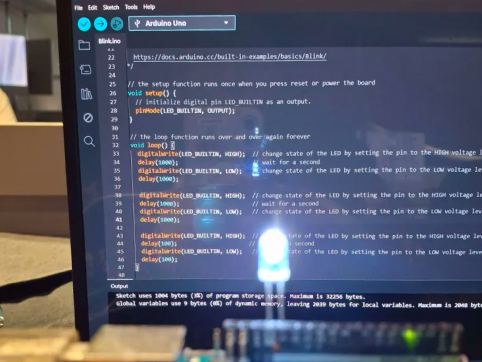
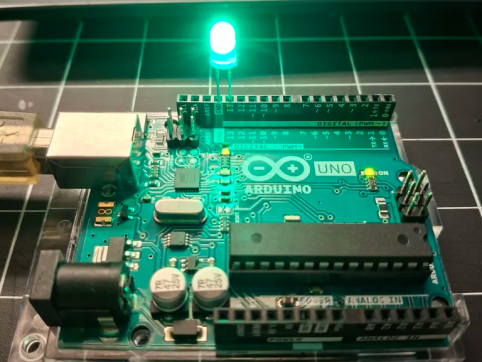
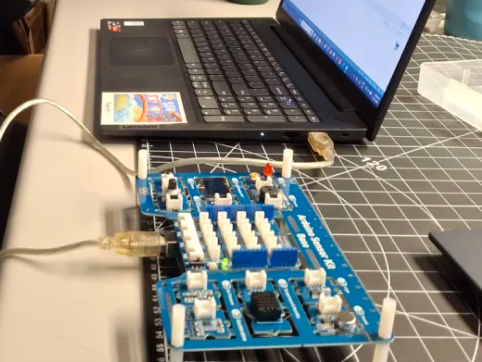
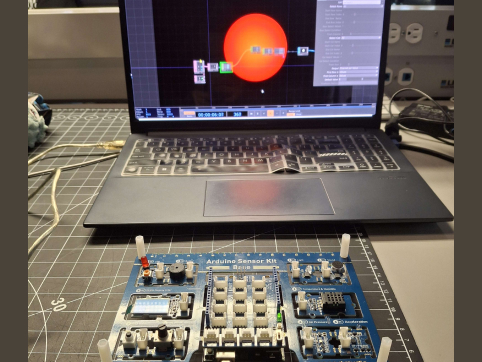
Closeup of an Arduino microcontroller used in this activity. In order to code this microcontroller, we have to connect it to a device with access Arduino IDE. This was easy enough as all I had to do was plug it into my laptop. An important part in Arduino IDE is making sure its's connected to the correct port. My code didn't work at first but that was because I had selected a different port than the one the Arduino was plugged into. To test, we used a blinking sample sketch built into Arduino IDE to let LEDs blink repeatedly. I played around with he code to play in different sequences I also tested different LED colours to make sure I really understood how to connect them properly to the Arduino.

Activity 2

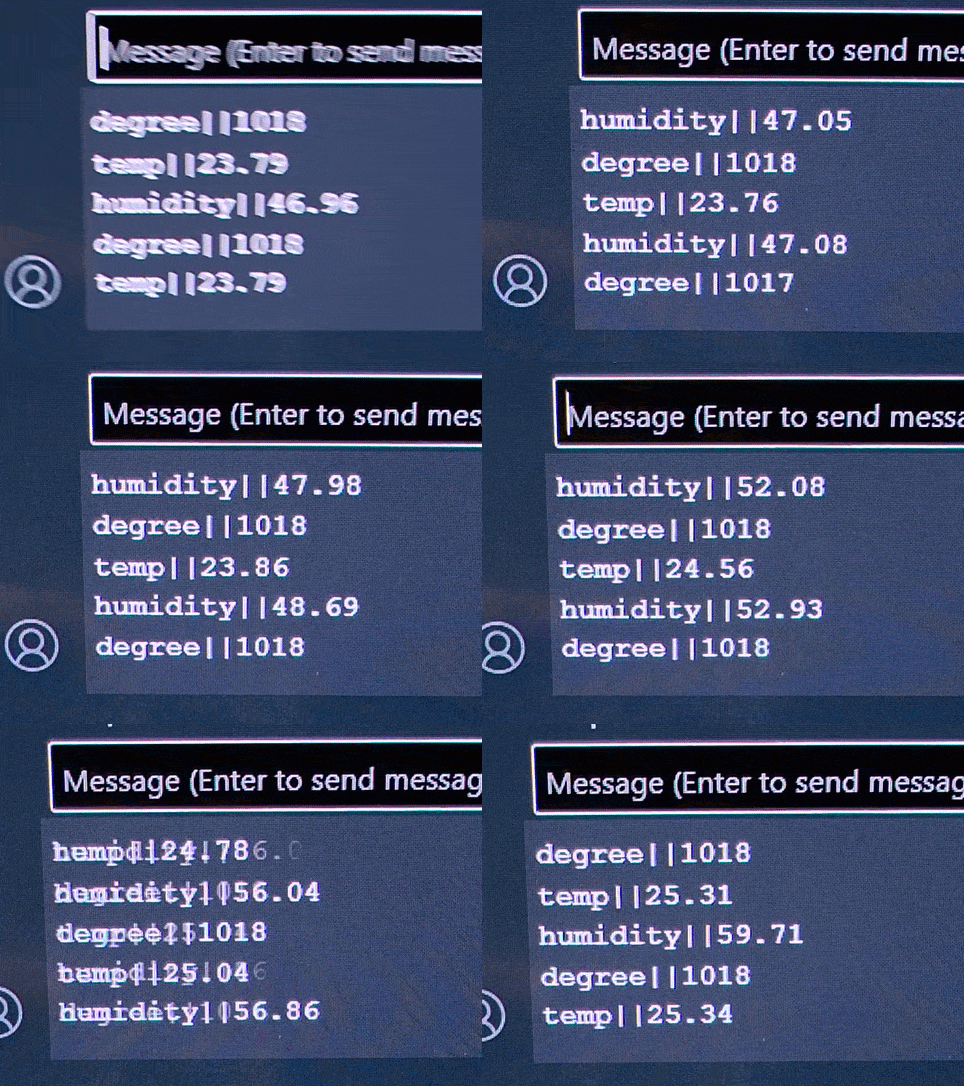
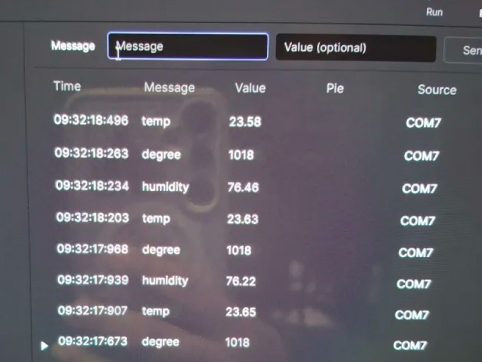
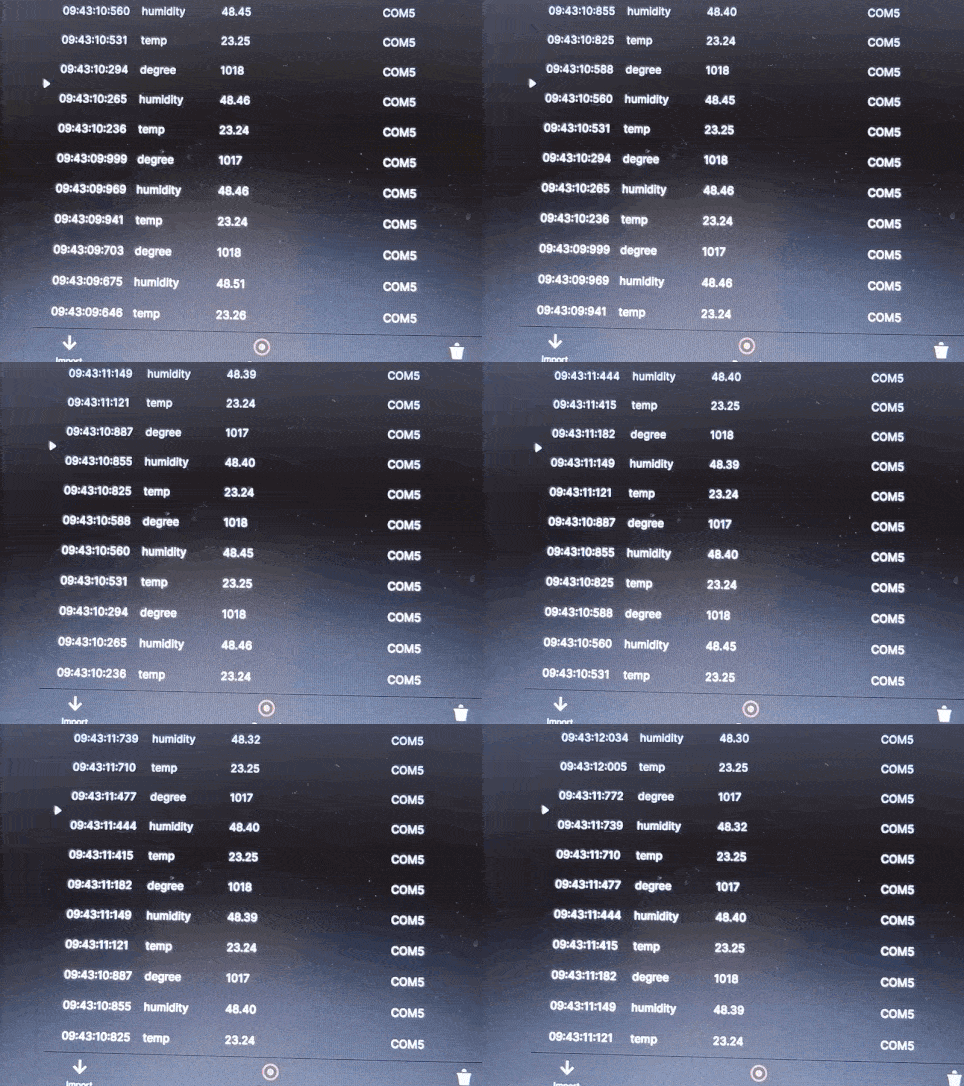
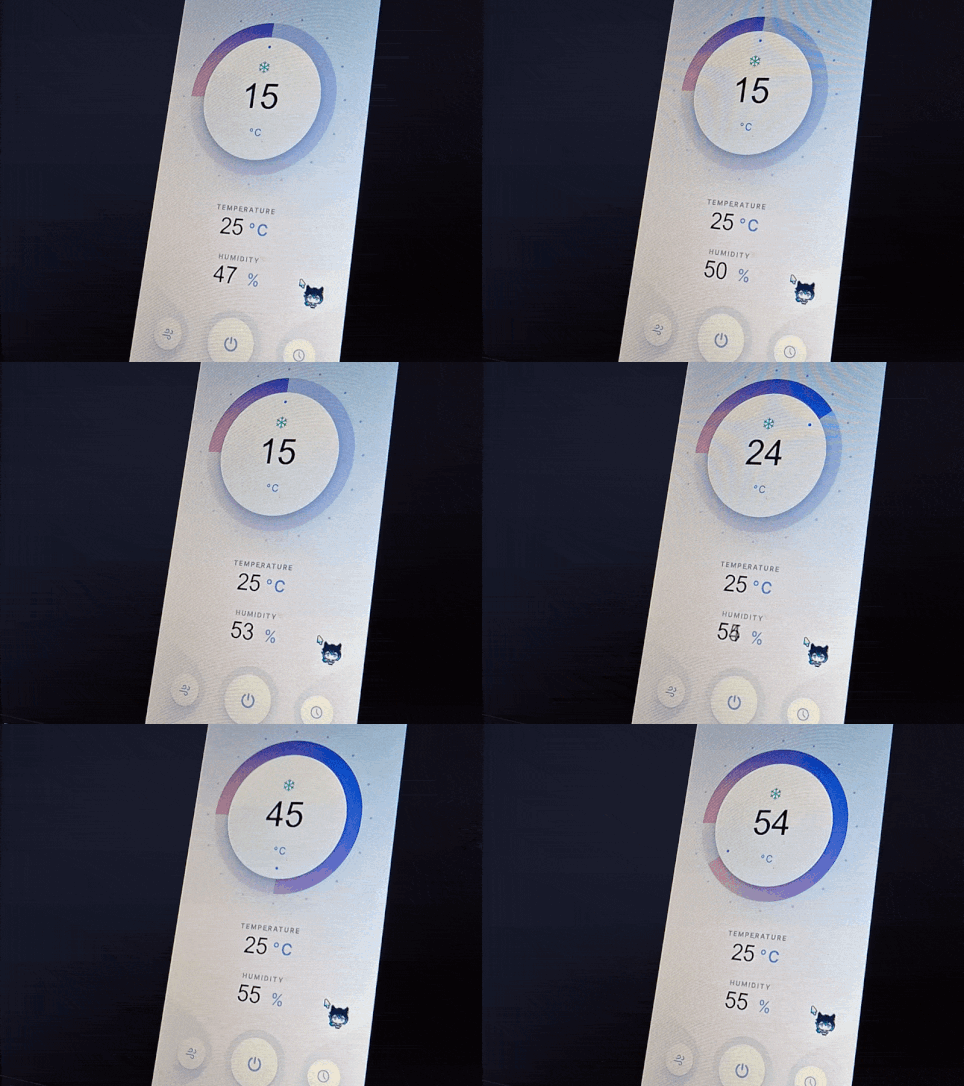
The Arduino Uno was with this board in this activity since it can detect multiple types of inputs. When everything is set up, it records humidity and temperature data and displays it in the serial monitor as shown above. Connecting the Arduino to ProtoPie required using Connect. Before testing the actual prototype, I made sure it worked properly by viewing the data in Connect itself The data displayed itself in an identical way it did in IDE. This helped when trouble shooting Connect since it showed that the actual sensors weren't the issue. The prototype replicates home apps that detect temperature and similar values. This is was good reference to show what's possible to do with sensor data.

Activity 3

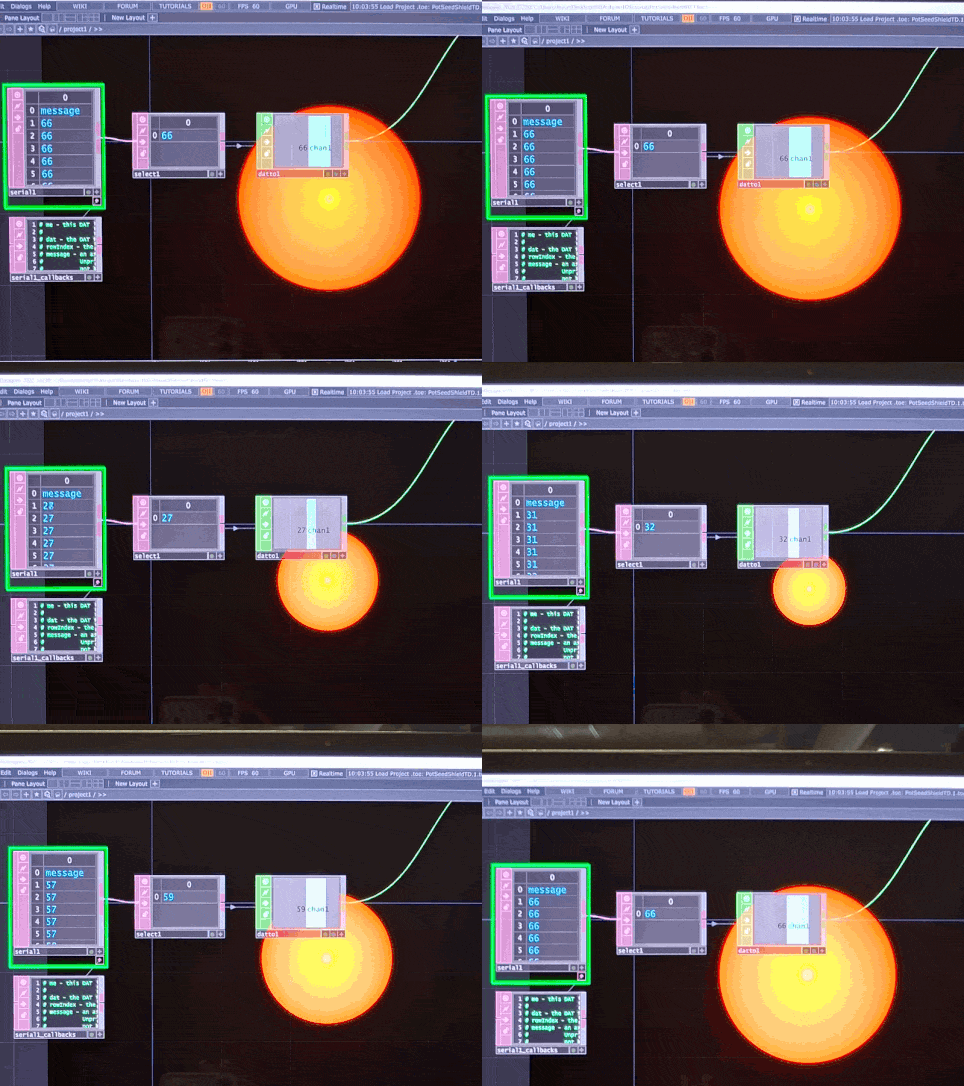
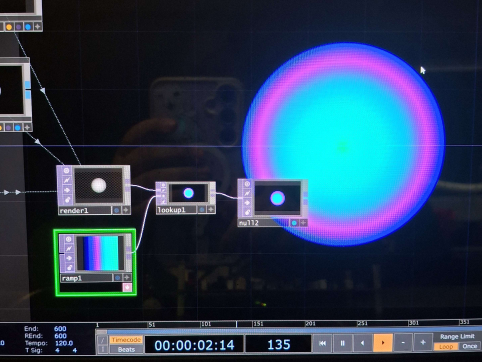
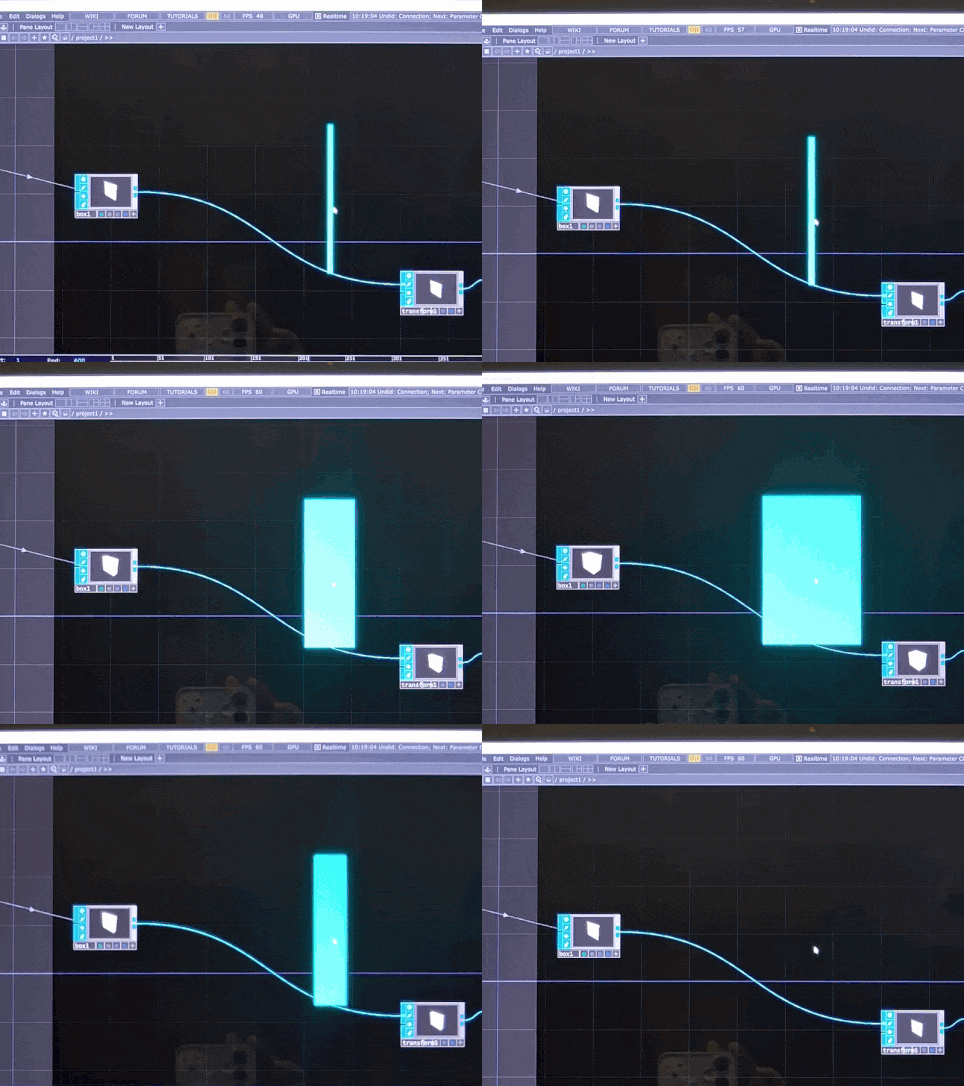
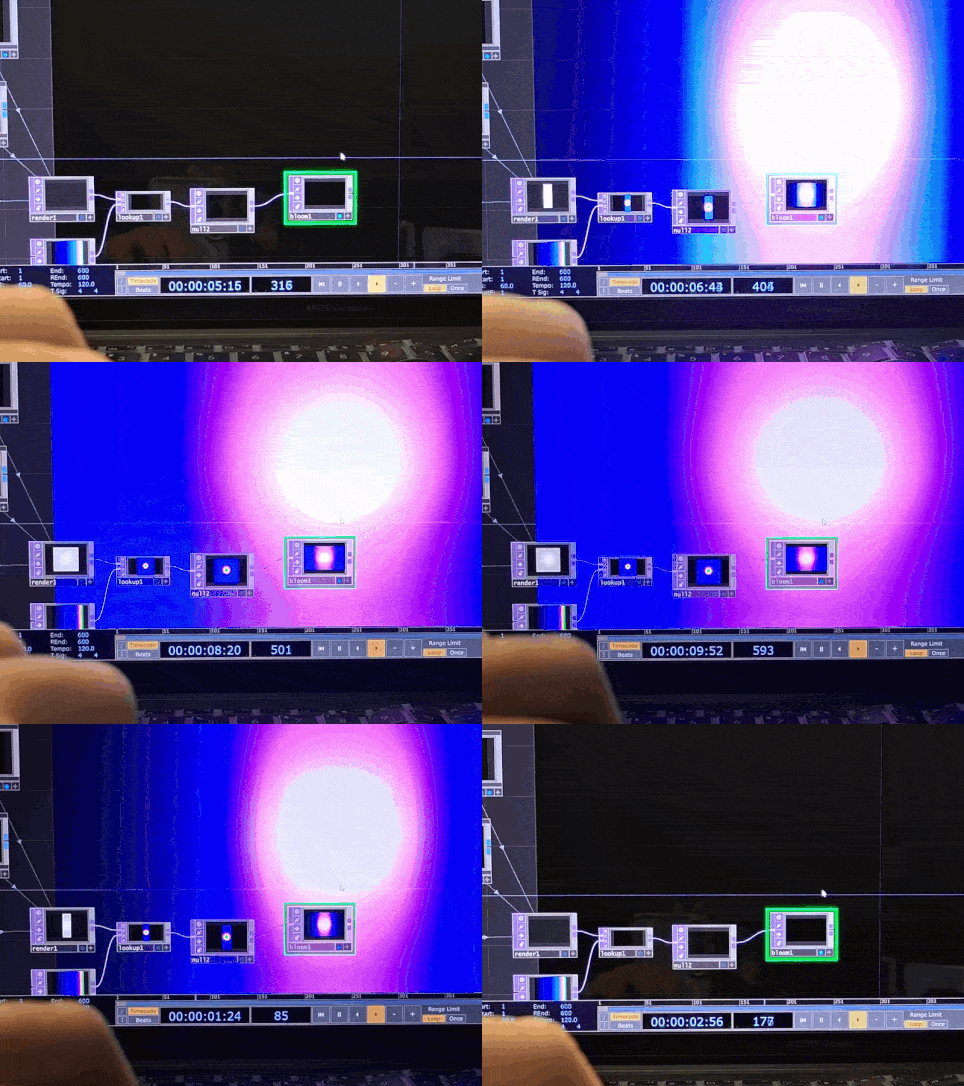
Starting with Touch Designer in this module, sample code using the value of the dial of the board was used. This project file connected the dial value to the scale of the generated graphic. This was interesting as it let us directly control the size of the shape. I began experimenting with the different nodes in the project file to get different effects. This helped with familiarizing myself with Touch Designer ecosystem. I also replaced the sphere with a box in the node sequence and because the way it handles scale is different from spheres, it made the design extend out rather than scale up or down. Adding on top of the current project allowed me to create interesting visual effects as well. This flash design was made just by adding a bloom node onto the preexisting file but it's completely different from before.

Research Activity


Consumer Trend Research
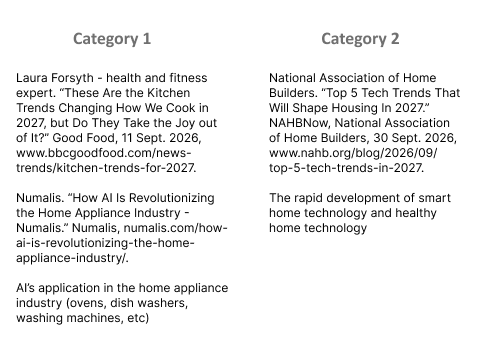
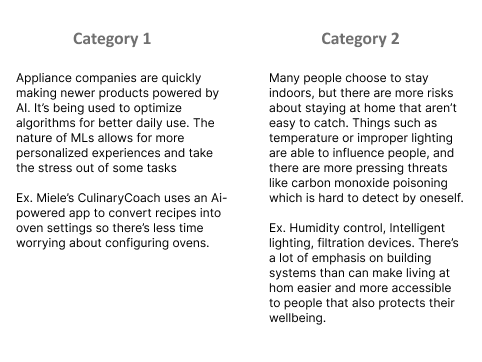
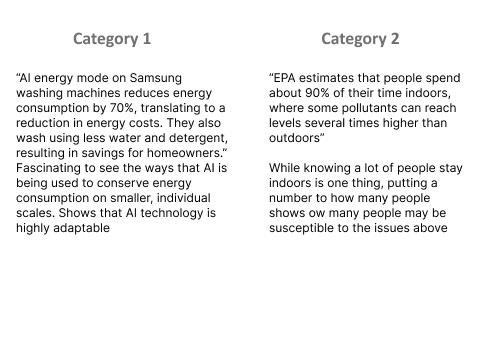
List your source and summarize the category What makes this category unique? Give an example of a product What's the most important statistic and how has it affected your choice?

Personas Research

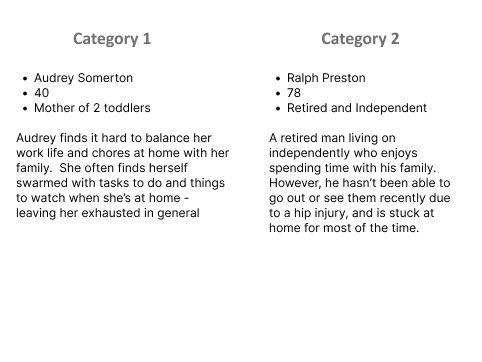
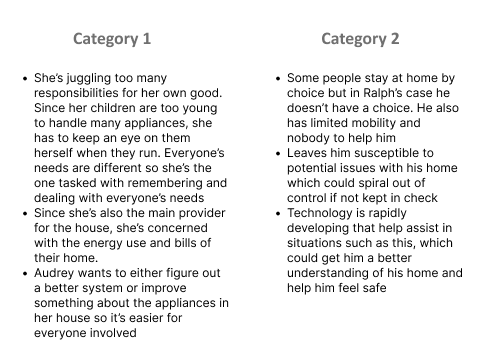
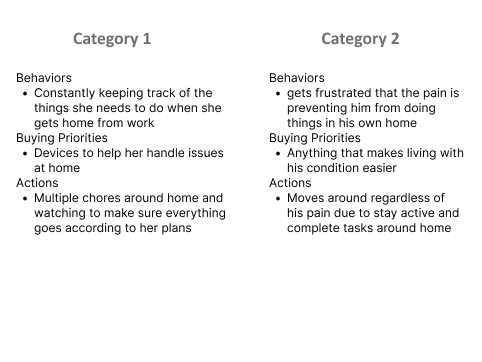
Persona Name + Summarize the Persona Describe the generational Impacts Name the most point of data from Behaviours, Buying Priorities and Actions

HMI Research

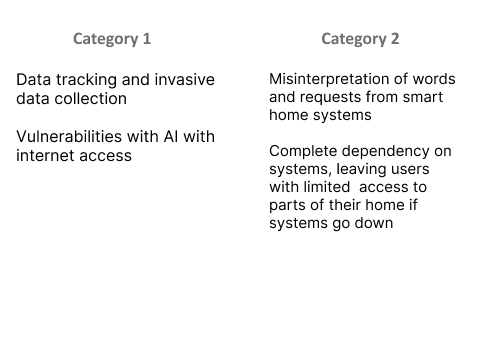
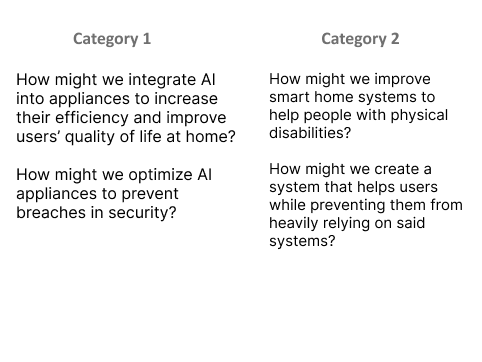
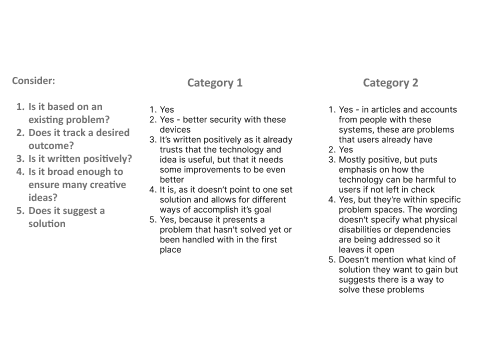
Identify two problem spaces for each trend Two HMI/HMW statements for each trend Considerations

Project Path

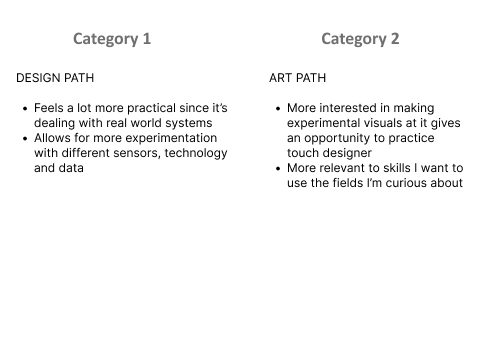
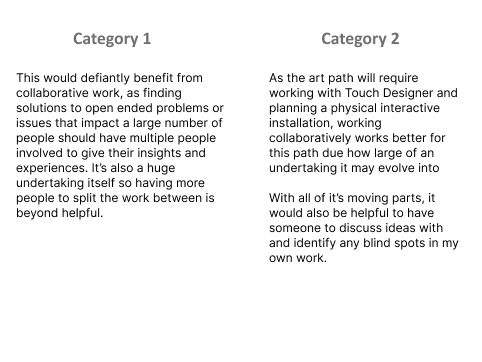
Design or Art Path? Collaboration or Individual work? Path Directions

Project 1 Concept


Project 1 Concept

Large buildings and spaces can be hard to navigate, and it's especially hard for people new to their environments have had the stress of figuring out where to go. For new student in a college campus building this is especially true.

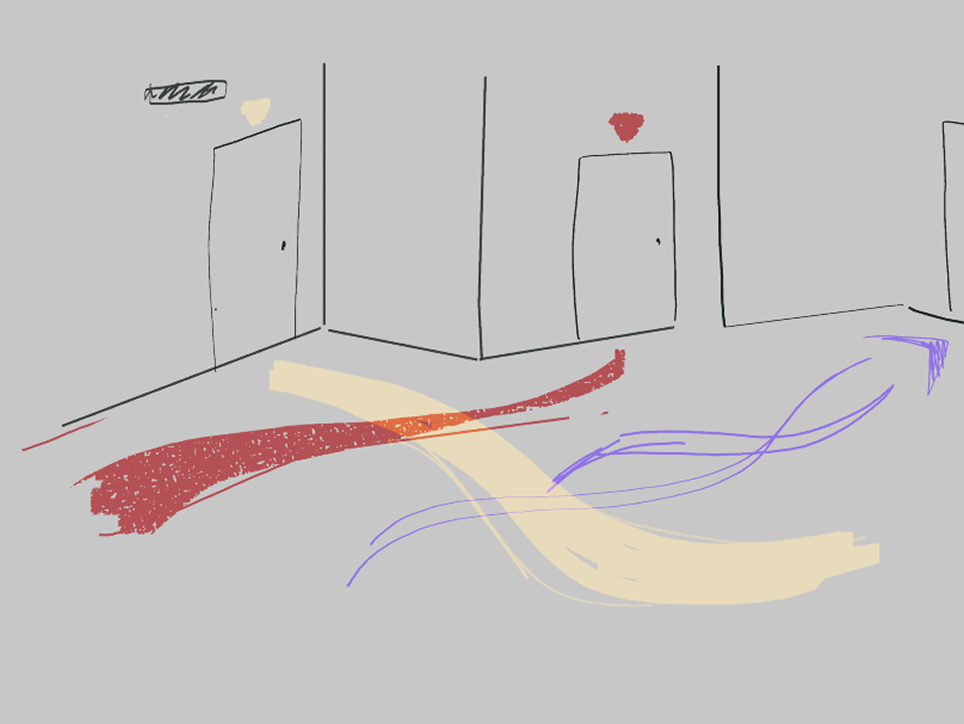
On a larger scale, my concept is designed to help guide students through unfamiliar buildings in their campus. This is a project in the Art Path, using projection mapping to display multiple interactive pathway designs that lead to different locations or places of interest. Each of these pathways would be customised to where they're pointing to. For example, paths leading to illustration wings may have a hand painted style, while paths leading to programming wings could have a more tech-styled design.

For the scope of this course, I'd create an interactive projection design that guides people to different parts of a room they might not be familiar with, and give visual pointers for their purposes.
×

Powered by w3.css